The world of crypto and stock trading, understanding chart patterns is like having a secret decoder ring. These visual representations of market data hold the key to predicting future price movements. If you're a TradingView user diving into the crypto or stock markets, mastering chart patterns is essential. In this article, we'll delve into the world of chart patterns, shedding light on their significance in both crypto and stock trading. Let's explore how these patterns can help you make informed decisions and optimize your trading strategy.
What Are Chart Patterns?
Chart patterns are graphical representations of historical price movements. They are like roadmaps of market sentiment and can help traders identify potential trends. Whether you're trading crypto or stocks, understanding these patterns is crucial for making informed trading decisions.
Why Use TradingView for Chart Analysis?
TradingView is a popular platform for traders of all levels. It offers powerful charting tools and a vast community of traders sharing insights and analysis. With TradingView, you can easily access and analyze various chart patterns, making it an ideal platform for traders in both the crypto and stock markets.
Top Chart Patterns in Crypto and Stock Trading
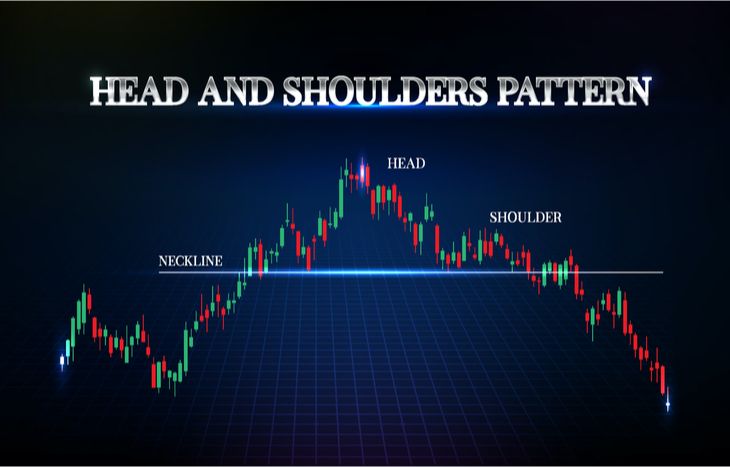
1. Head and Shoulders:
This pattern signals a potential reversal in the market trend. In a bullish market, it appears as an upward trend reversal, while in a bearish market, it signals a downward trend reversal.

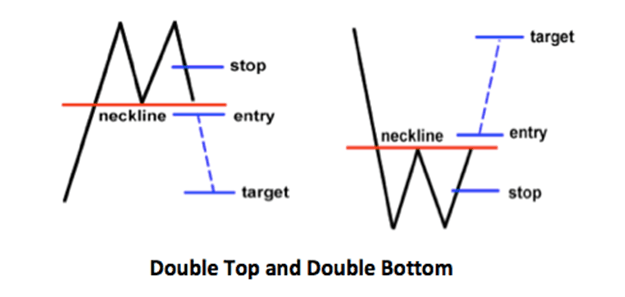
2. Double Top and Double Bottom:
Double tops suggest a reversal from a bullish to a bearish trend, while double bottoms indicate a reversal from a bearish to a bullish trend.

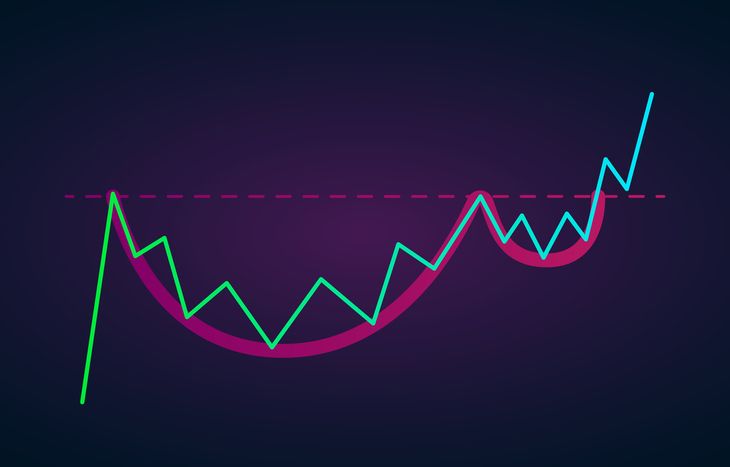
3. Cup and Handle:
This pattern is a bullish continuation pattern, indicating a potential price surge after a consolidation phase.

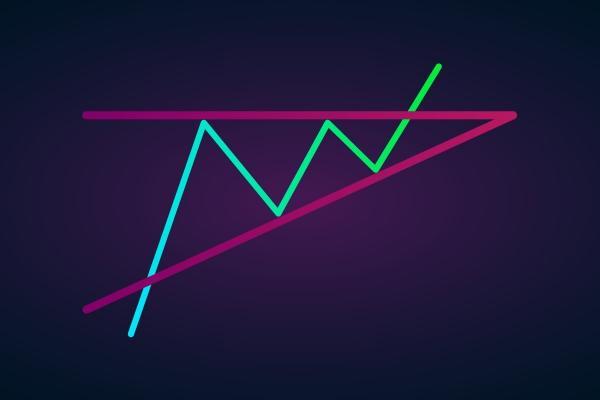
4. Ascending and Descending Triangles:
These patterns represent a period of consolidation, with the potential for a breakout in the direction of the prevailing trend.

How to Use Chart Patterns for Trading
- Identify Patterns: Use TradingView's charting tools to spot patterns in crypto or stock charts. Pay attention to the shape and structure of the patterns.
- Confirm Patterns: Look for additional indicators like volume and support/resistance levels to confirm the validity of the pattern.
- Set Entry and Exit Points: Once you've identified a pattern, set clear entry and exit points based on the pattern's projected price movement.
- Risk Management: Always implement proper risk management techniques, such as stop-loss orders, to protect your capital.
Conclusion
In the crypto and stock markets, chart patterns are invaluable tools for traders. They provide insights into market sentiment and potential price movements. As a TradingView user, you have access to a powerful platform for analyzing these patterns and making well-informed trading decisions.
By understanding and leveraging chart patterns, you can enhance your trading strategy, whether you're in the world of crypto or stock trading. So, dive into the world of chart patterns, and let them guide you on your journey to trading success.


